Appearance
SAP Cloud ALM for Operations
- Features, functions and processes for operating your cloud centric solution landscapes.
- Having a central entry point to operate your complete SAP landscape running on different technologies.
User & Performance Monitoring
Real User Monitoring
The purpose of Real User Monitoring is to provide transparency about the usage (executions) and the performance (response times) of user interactions. It supports the monitoring request executions from different platforms with a unified user experience using a common look-and-feel and handling pattern.
The basic concept is to get all user interactions and the relevant server requests which are the correlated in the Real User Monitoring application. Request executions are rated not based on fixed thresholds but on historical values.
| Feature | Description |
|---|---|
| Overview | Overview of the performance metric for services in your scope and your favorites in the selected time range is displayed as the Apdex (Application Performance Index). |
| Request Overview | The Request Overview provides for the selected time range. |
| Analysis View | Analysis View provides flexible selection of metrics and dimensions for analysis and download functionality. |
| Frontend Overview | In this page, the most important front-end usage and performance metrics for the following frond-end request types are displayed. |
Health Monitoring
In the Health Monitoring application you can check the health of your monitored cloud service and technical systems from an application and customer perspective. Technical metrics are collected on a regular basis and can be used to calculate the overall health of the monitored object. The monitored metrics are defined by the service itself and may differ for each service type.
| Feature | Description |
|---|---|
| Overview | In the overview screen you can see the current status of all cloud services or technical systems which are connected to Health Monitoring. An overall health is calculated based on the number of metrics in warning or critical status. |
| Monitoring | The metric details for each monitored object can be shown when it is selected from the overview page. There you can see a list of components and metrics. Each component or metric is represented by a tile which summarizes the current value and rating. By clicking on a tile you will get more details on all contained metrics. |
| Analytics | For each metric it is possible to show the historical values of the metric. Here you can identify trends or investigate at which time a specific resource shortage has occurred. |
Data Collection Infrastructure
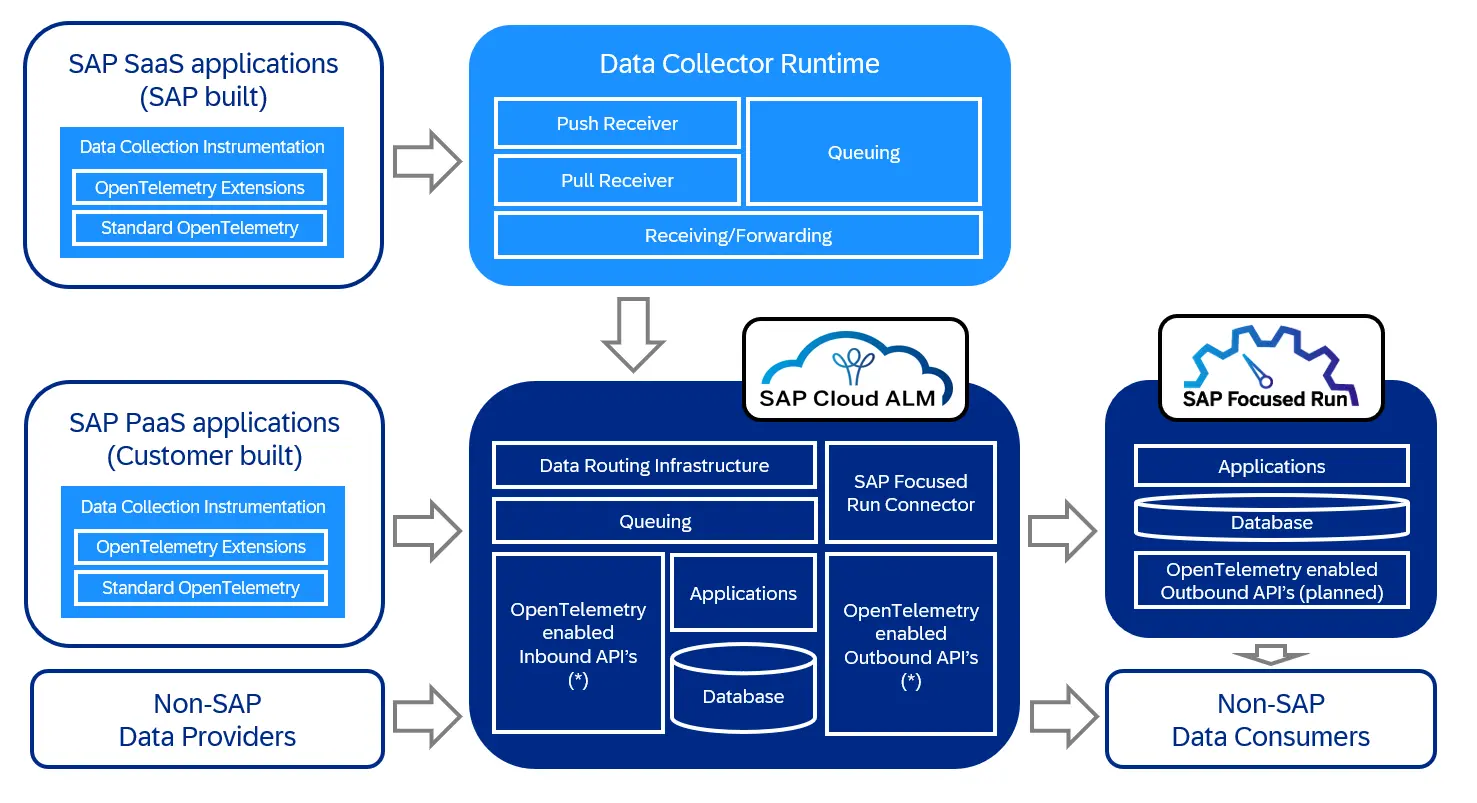
Observability with OpenTelemetry@SAP through SAP Cloud ALM for operations.
SAP built SAP SaaS applications as well as customer built SAP PaaS applications are instrumented with the same Data Collection Instrumentation Libraries, which produce monitoring data based on standard OpenTelemetry. Furthermore, SAP has defined certain OpenTelemtry extensions.
The data from SAP built applications is transferred by the Data Collector Runtime service (which is completely managed by SAP) to SAP Cloud ALM. The data from customer built applications is transferred directly to SAP Cloud ALM, where the Queueing is taking care to store the data in the SAP Cloud ALM database. In SAP Cloud ALM you have to switch-on the monitoring for the respective service per use case.
As OpenTelemetry follows an open standard inbound API's can be used to integrate non-SAP data providers with SAP Cloud ALM. OpenTelemetry enabled Outbound API's can be used to integrate non-SAP data consumers. Please check the following link to find more information about these SAP Cloud ALM Raw data APIs.
Additionally, it is possible to also transfer the data to a SAP Focused Run system, in case the customer himself or its service provider has a SAP Focused Run system in use.
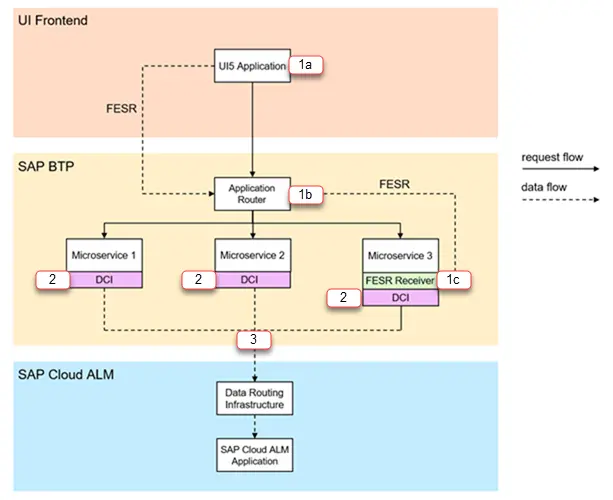
High Level Architecture
The graphic below depicts the high-level architecture of the OpenTelemetry data collection. In this simple scenario, we assume, that we want to monitor a full-stack application built on SAP BTP, Cloud Foundry environment or in SAP BTP, Kyma runtime. The front end consists of SAP UI5. The UI requests will be routed to the application backend via the Application Router. Here in our example, the application backend consists of three different microservices.